1 Requirements
sudo apt install pandoc
sudo apt install graphviz graphviz-dev
sudo apt install dot2tex latex2html dvipng
sudo pip3 install pygraphviz pandocfilters
if need show latex equation in graphviz, also install latex.
2 Graphviz
由图, 节点, 边组成.
2.1 基本语法
- 字符串 都要加双引号, 可以加
\n换行符 - 注释 双斜杠
//或/* */ - 有向图 digraph, 节点关系: 指向->
- 无向图 graph, 节点关系: 连通 --
- 子图 subgraph, 子图必须以cluster做为名称的前缀
- 属性 node[attribute1=value1, attribute2=value2]
- 大小: size="2,2"; 单位为英寸
- 标签: label="显示在图上的内容"
- 边: edge [color=red,style=dotted]
- 节点: node [color=navy]
- 边方向: rankdir=参数值;LR,RL,BT,TB
- 节点形状: a[shape=box]; 默认是椭圆
- 边框大小: a[width=.1,height=2.5]; 单位为英寸
- 边框颜色: a[color=red];
2.2 构造边
| 关系 | 有向图 | 无向图 |
|---|---|---|
| 一对一 | a->b; | a--b; |
| 一对多 | a->{b;c;d}; | a--{b;c;d}; |
| 多对一 | {b;c;d}->a; | {b;c;d}--a; |
| 多对多 | {m,n,p,q}->{b;c;d}; | {m,n,p,q}--{b;c;d}; |
2.3 属性
2.3.1 通用属性
| 属性名称 | 默认值 | 含义 |
|---|---|---|
| color | black | 颜色,颜色设置支持形如red和#FF0000两种形式 |
| fontcolor | black | 文字颜色 |
| fontname | Times-Roman | 字体 |
| fontsize | 14 | 文字大小 |
| label | 显示的标签,支持''换行,对于节点默认为节点名称 | |
| penwidth | 1.0 | 线条宽度 |
| style | 图形选项,例如 bold, dotted, filled 等 | |
| layer | 覆盖范围 | all id 或 id:id |
2.3.2 图的属性
| 属性名称 | 默认值 | 含义 |
|---|---|---|
| bgcolor | 背景颜色 | |
| center | false | 在page的中心画图 |
| clusterrank | local | global或none |
| concentrate | false | 让多条边有公共部分 |
| nodesep | .25 | 节点之间的间隔(英寸) |
| peripheries | 1 | 边界数 |
| rank | same,min,source, max,sink,设置多个节点顺序 | |
| rankdir | TB | 排序方向, LR,RL,BT,TB |
| ranksep | .75 | 间隔,等级之间的间隔,英寸 |
| size | 图的大小(英寸) | |
| splines | 控制边的形状 none | |
| labelloc | 调整图或子图的标签的上下位置 | |
| labeljust | 调整图或子图的标签的左右位置 | |
| compound | false | If true, allow edges between clusters. 配合lhead和ltail使用 |
| margin | .5 | page的空白,英寸 |
| mclimit | 1.0 | mincross的跌带比例因子 |
| nslimit | -- | 如果设置了f,则使用网络界限迭代f(结点数)来设置x坐标 |
| nslimit1 | -- | 如果设置了f,则使用网络界限迭代f(结点数)设置结点排名(rank) |
| ordering | -- | 如果out则外部边缘顺序会保留 |
| orientation | portrait | 如果没用rotate,而值为landscape,使用风景画定位 |
| page | -- | 标记页,例如"8.5,11" |
| pagedir | BL | 多页之间的横断 |
| quantum | -- | 结点标签的尺寸根据quantum的量度 |
| ratio | -- | 近似朝向approximate aspect ratio desired,fill或auto |
| remincross | -- | 如果为true且有多个集群,重新运行crossing最小化 |
| rotate | -- | 如果为90,设置朝向 |
| samplepoints | 8 | 输出时用以表现椭圆和圆所用的点数,参见附录C |
| searchsize | 30 | 切除的最大边缘,当用以寻找网络中的最小一个(完全没看懂?) |
2.3.3 节点属性
| 属性名称 | 默认值 | 含义 |
|---|---|---|
| shape | ellipse | 形状, ellipse |
| sides | 4 | 当shape=polygon时的边数 |
| skew | 0.0 | 当shape=polygon, [-1.0,1.0], 从上到下的倾斜度, 相位差, 矩形转换成平行四边形 |
| distortion | 0.0 | 当shape=polygon, 从上到下缩短多边形, 扭曲, 矩形变成梯形 |
| orientation | 0.0 | 多边形的曲线方向和角度, 旋转角度 |
| peripheries | 边界曲线数量, 双圆环peripheries=2 | |
| regular | false | 使多边形变得规则 |
| fillcolor | lightgrey/black | 填充颜色 |
| fixedsize | false | 标签是否影响节点的大小 |
| group | 节点所属的组 | |
| height | .5 | 以英寸为单位的高度 |
| width | .75 | 以英寸为单位的宽度 |
2.3.4 边的属性
| 属性名称 | 默认值 | 含义 |
|---|---|---|
| arrowhead | normal | 箭头头部形状 |
| arrowsize | 1.0 | 箭头大小 |
| arrowtail | normal | 箭头尾部形状 |
| constraint | true | 是否根据边来影响节点的排序 |
| decorate | 设置之后会用一条线来连接edge和label | |
| dir | forward | 设置方向:forward,back,both,none |
| headclip | true | 是否到边界为止 |
| headport | n,ne,e,se,s,sw,w,nw | |
| tailclip | true | 与headclip类似 |
| headlabel | 边的头部显示的标签 | |
| taillabel | 边的尾部显示的标签 | |
| tailport | -- | n,ne,e,se,s,sw,w,nw |
| lhead | 当compound为true时,lhead用于指定边指向的cluster | |
| ltail | 与ltail类似 | |
| labelangle | -25.0 | 边标签的旋转角度 |
| labeldistance | 1.0 | 边标签距离结点的比例因子 |
| labelfloat | false | 边标签位置的强制约束 |
| labelfontcolor | black | 标签字体颜色 |
| labelfontname | Times-Roman | 标签字体族 |
| labelfontsize | 14 | 标签字体大小 |
| weight | 1 | 边的延伸花费整数 |
| minlen | 1 | 头尾间最小长度 |
| samehead | -- | 头结点的tag,拥有相同头结点tag的边会使用统一端点 |
| sametail | -- | 同上,尾结点 |
3 Demo
3.1 docsG
3.2 office example
```{.graph .center caption="Demo" fileName="test"}
digraph G {
  bgcolor="#ffffff00"

  subgraph cluster_0 {
    style="filled, rounded";
    color="#E6EAF2"
    node [style=filled,color=white];
    a0 -> a1 -> a2 -> a3;
    a3 -> a1 [label = " -10" color=red fontcolor=red];
    label = "System A";
  }

  subgraph cluster_1 {
    node [style=filled color="#E6EAF2"];
    b0 -> b1 -> b2 -> b3;
    b0 -> b2 [label = " +12" color=green fontcolor=green];
    label = "System B";
    style="dashed, rounded"
    color=blue
  }

  start -> a0;
  start -> b0;
  a1 -> b3;
  a3 -> end;
  b3 -> end;

  start [label="load" shape=folder];
  end [label="store" shape=box3d];
}
```
output:

3.3 subgraph
```{.graph .center caption="Subgraph Demo" fileName="graphviz_subgraph_1"}
digraph G {
  compound=true;
  node [ shape = "Mrecord" ];
  subgraph cluster_0 {
    style = rounded;
    label = "Zero";
    Node_0_0 -> Node_0_1;
  };
  subgraph cluster_1 {
    style = rounded;
    label = "One";
    Node_1_0 -> Node_1_1;
  };
  subgraph cluster_2 {
    style = rounded;
    label = "Two";
    Node_2_0 -> Node_2_1;
  };
  NodeA [ style = rounded ];
  NodeA -> Node_0_0 [lhead = cluster_0];
  NodeA -> Node_1_0 [lhead = cluster_1];
  NodeA -> Node_2_0 [lhead = cluster_2];
}
```
output:

3.4 edge direction
```{.graph .center caption="Edge Direction Demo" fileName="graphviz_edge_1"}
digraph G {
    A -> B[dir = both]
    B -> C[dir = nonc]
    C -> D[dir = back]
    D -> A[dir = forward]
}
```
output:

3.5 edge position
```{.graph .center caption="Edge Position Demo" fileName="graphviz_edge_2"}
digraph G {
   node[shape = box]
   c:n -> d[label = n]
   c1:ne -> d1[label = ne]
   c2:e -> d2[label = e]
   c3:se -> d3[label = se]
   c4:s -> d4[label = s]
   c5:sw -> d5[label = sw]
   c6:w -> d6[label = w]
   c7:nw -> d7[label = nw]
}
```
output:

3.6 prog
默认prog=dot, neato更适合画无向图
```{.graph .center prog=neato fileName="graphviz_prog" caption="Star network topology."}
graph ER {
    bgcolor="#ffffff00"
    A -- 1
    A -- 2
    A -- 3
    A -- 4
    A -- 5
}
```
output:

3.7 rank
```{.graph .center caption="Rank Demo" fileName="graphviz_rank_1"}
digraph G {
   rankdir = LR
   {
    node[shape = plaintext]
    1995 -> 1996 -> 1997 -> 1998 -> 1999 -> 2000 -> 2001
   }
   {
    node[shape = box, style = filled]
    WAR3 -> Xhero -> Footman -> DOTA
    WAR3 -> Battleship
   }
   {
    {rank = same 1996 WAR3}
    {rank = same 1998 Xhero Battleship}
    {rank = same 1999 Footman}
    {rank = same 2001 DOTA}
   }
}
```
output:
3.8 label
3.8.1 demo1
```{.graph .center caption="Label Demo 1" fileName="graphviz_label_1"}
graph G {
   label = "我爱你" /*为图设置标签*/
   labelloc = b    /*图标签的位置在底部,也可以设置为t到顶部*/
   labeljust = l   /*图标签的位置在左边,也可以设置为r到右边*/

   edge[decorate = true]
   C -- D[label = "s1"]
   C -- E[label = "s2"]
   C -- F[label = "s3"]
   D -- E[label = "s4"]
   D -- F[label = "s5"]

   edge[decorate = false, labelfontcolor = blue, fontcolor = red]
   C1 -- D1[headlabel = "d1", taillabel = "c1", label = "c1 - d1"]
}
```
output:

3.8.2 demo2
```{.graph .center caption="Label Demo 2" fileName="graphviz_label_2"}
graph G2 {
    node [shape=box]; User; Object; Tag;
    node [shape=diamond,style=filled]; Triple;
    {
        User   -- Triple [headlabel = "1", labeldistance=2.5, labelangle=20]; // 逆时针20度
        Object -- Triple [headlabel = "1", labeldistance=1.5, labelangle=-20];// 顺时针20度
    }
    {
        rank=same;
        User;
        Object;
    }
    Triple -- Tag [label="n", headlabel = "2"];
}
```
output:

3.9 distance
```{.graph .center caption="Distance Demo" fileName="graphviz_distance_1"}
digraph A {
  rankdir=LR;
  center=true; margin=1;    // 居中, 空白地方的大小
  nodesep=2.5; ranksep=1.5; // 如果 randir是LR, 左右用ranksep, 上下使用nodesep.
  size="3,3";

  node [shape=point, height=".2", width=".2"];

  a [xlabel="a"];
  b [xlabel="b"];
  c [xlabel="c"];
  a -> b -> c;
  a -> c;
}
```
output:

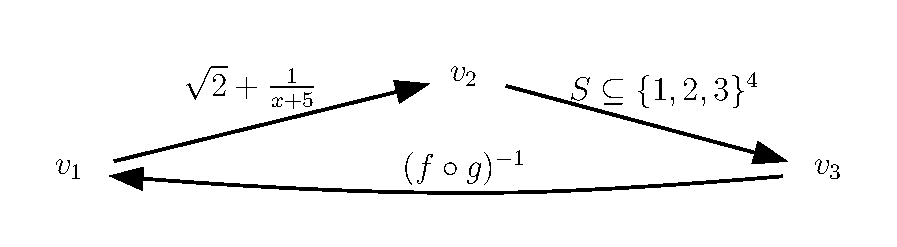
3.10 latex graph
```{.graph .center caption="Latex_Graph_Demo" fileName="ladotdemo" latex="true" resolution="1080" desity="100"}
digraph mydot {
    rankdir=LR
    node [shape=plaintext, width=0]
    $v_1$(2)
    $v_1$ -> $v_2$(2) [label=$\sqrt{2}+\frac{1}{x+5}$(9)]
    $v_2$ -> $v_3$(2) [label=$S \subseteq \{1,2,3\}^4$(6)]
    $v_3$ -> $v_1$ [label=$(f \circ g)^{-1}$(7)]
}
```
output:
3.11 neural network
3.11.1 simplest
```{.graph .center caption="simplest" fileName="graphviz_simplest"}
digraph G {
    rankdir=LR;   /* makes the directed graphs drawn from left to right */
    splines=line; /* force edges to be straight, no curves or angles */
    nodesep=.05;  /* forces edges to become invisible */
    node [label=""];   /* [ ] sets the default node property */

    subgraph cluster_0 {
        color=white;
        node [style=solid,color=blue4, shape=circle];
        x1 x2 x3;
        label = "layer 1";
    }

    subgraph cluster_1 {
        color=white;
        node [style=solid,color=red2, shape=circle];
        a12 a22 a32 a42 a52;
        label = "layer 2";
    }

    subgraph cluster_2 {
        color=white;
        node [style=solid,color=red2, shape=circle];
        a13 a23 a33 a43 a53;
        label = "layer 3";
    }

    subgraph cluster_3 {
        color=white;
        node [style=solid,color=seagreen2, shape=circle];
        O1 O2 O3 O4;
        label="layer 4";
    }

    x1 -> a12;
    x1 -> a22;
    x1 -> a32;
    x1 -> a42;
    x1 -> a52;

    x2 -> a12;
    x2 -> a22;
    x2 -> a32;
    x2 -> a42;
    x2 -> a52;

    x3 -> a12;
    x3 -> a22;
    x3 -> a32;
    x3 -> a42;
    x3 -> a52;

    a12 -> a13
    a22 -> a13
    a32 -> a13
    a42 -> a13
    a52 -> a13

    a12 -> a23
    a22 -> a23
    a32 -> a23
    a42 -> a23
    a52 -> a23

    a12 -> a33
    a22 -> a33
    a32 -> a33
    a42 -> a33
    a52 -> a33

    a12 -> a43
    a22 -> a43
    a32 -> a43
    a42 -> a43
    a52 -> a43

    a12 -> a53
    a22 -> a53
    a32 -> a53
    a42 -> a53
    a52 -> a53

    a13 -> O1
    a23 -> O1
    a33 -> O1
    a43 -> O1
    a53 -> O1

    a13 -> O2
    a23 -> O2
    a33 -> O2
    a43 -> O2
    a53 -> O2

    a13 -> O3
    a23 -> O3
    a33 -> O3
    a43 -> O3
    a53 -> O3

    a13 -> O4
    a23 -> O4
    a33 -> O4
    a43 -> O4
    a53 -> O4
}
```
output:

3.11.2 complicated case
```{.graph .center caption="complicated" fileName="graphviz_complicated"}
digraph G {
    rankdir = LR;
    splines=false;
    edge[style=invis];  /* hide the edges */
    ranksep= 1.4;

    /* {...} specifies the scope of the node property */
    {
        node [shape=circle, color=yellow, style=filled, fillcolor=yellow];
        x0 [label=<x<sub>0</sub>>];
        a02 [label=<a<sub>0</sub><sup>(2)</sup>>];
        a03 [label=<a<sub>0</sub><sup>(3)</sup>>];
    }
    {
        node [shape=circle, color=chartreuse, style=filled, fillcolor=chartreuse];
        x1 [label=<x<sub>1</sub>>];
        x2 [label=<x<sub>2</sub>>];
        x3 [label=<x<sub>3</sub>>];
    }
    {
        node [shape=circle, color=dodgerblue, style=filled, fillcolor=dodgerblue];
        a12 [label=<a<sub>1</sub><sup>(2)</sup>>];
        a22 [label=<a<sub>2</sub><sup>(2)</sup>>];
        a32 [label=<a<sub>3</sub><sup>(2)</sup>>];
        a42 [label=<a<sub>4</sub><sup>(2)</sup>>];
        a52 [label=<a<sub>5</sub><sup>(2)</sup>>];
        a13 [label=<a<sub>1</sub><sup>(3)</sup>>];
        a23 [label=<a<sub>2</sub><sup>(3)</sup>>];
        a33 [label=<a<sub>3</sub><sup>(3)</sup>>];
        a43 [label=<a<sub>4</sub><sup>(3)</sup>>];
        a53 [label=<a<sub>5</sub><sup>(3)</sup>>];
    }
    {
        node [shape=circle, color=coral1, style=filled, fillcolor=coral1];
        O1 [label=<a<sub>1</sub><sup>(4)</sup>>];
        O2 [label=<a<sub>2</sub><sup>(4)</sup>>];
        O3 [label=<a<sub>3</sub><sup>(4)</sup>>];
        O4 [label=<a<sub>4</sub><sup>(4)</sup>>];
    }
    {
        rank=same;       /* Rank constraints on the nodes in a subgraph. */
        x0->x1->x2->x3;  /* specifies the relative position of the four nodes */
    }
    {
        rank=same;
        a02->a12->a22->a32->a42->a52;
    }
    {
        rank=same;
        a03->a13->a23->a33->a43->a53;
    }
    {
        rank=same;
        O1->O2->O3->O4;
    }
    a02->a03;  // prevent tilting
    l0 [shape=plaintext, label="layer 1 (input layer)"];
    l0->x0;
    {rank=same; l0;x0};
    l1 [shape=plaintext, label="layer 2 (hidden layer)"];
    l1->a02;
    {rank=same; l1;a02};
    l2 [shape=plaintext, label="layer 3 (hidden layer)"];
    l2->a03;
    {rank=same; l2;a03};
    l3 [shape=plaintext, label="layer 4 (output layer)"];
    l3->O1;
    {rank=same; l3;O1};
    edge[style=solid, tailport=e, headport=w];  /* let all the edges point to the same position. */
    {x0; x1; x2; x3} -> {a12;a22;a32;a42;a52};
    {a02;a12;a22;a32;a42;a52} -> {a13;a23;a33;a43;a53};
    {a03;a13;a23;a33;a43;a53} -> {O1,O2,O3,O4};
}
```
output:

3.12 others
3.12.1 节点形状
```{.graph .center caption="节点形状" fileName="graphviz_demo_other_1"}
digraph G {
    size = "4, 4";
    main [shape=box]; /* 这是注释 */
    main -> parse [weight=8];
    parse -> execute;
    main -> init [style=dotted];
    main -> cleanup;
    execute -> { make_string; printf}
    init -> make_string;
    edge [color=red]; // 设置生效
    main -> printf [style=bold,label="100 times"];
    make_string [label="make a\n字符串"];
    node [shape=box,style=filled,color=".7 .3 1.0"];
    execute -> compare;
}
```
output:

3.12.2 标签
```{.graph .center caption="标签实例" fileName="graphviz_demo_other_2"}
digraph G {
    a -> b -> c;
    b -> d;
    a [shape=polygon,sides=5,peripheries=3,color=lightblue,style=filled];
    c [shape=polygon,sides=4,skew=.4,label="hello world"]
    d [shape=invtriangle];
    e [shape=polygon,sides=4,distortion=.7];
}
```
output:

3.12.3 二分查找树
```{.graph .center caption="二分查找树" fileName="graphviz_demo_other_3"}
digraph g {
    node [shape = record,height=.1];
    node0[label = "<f0> |<f1> G|<f2> "];
    node1[label = "<f0> |<f1> E|<f2> "];
    node2[label = "<f0> |<f1> B|<f2> "];
    node3[label = "<f0> |<f1> F|<f2> "];
    node4[label = "<f0> |<f1> R|<f2> "];
    node5[label = "<f0> |<f1> H|<f2> "];
    node6[label = "<f0> |<f1> Y|<f2> "];
    node7[label = "<f0> |<f1> A|<f2> "];
    node8[label = "<f0> |<f1> C|<f2> "];
    "node0":f2 -> "node4":f1;
    "node0":f0 -> "node1":f1;
    "node1":f0 -> "node2":f1;
    "node1":f2 -> "node3":f1;
    "node2":f2 -> "node8":f1;
    "node2":f0 -> "node7":f1;
    "node4":f2 -> "node6":f1;
    "node4":f0 -> "node5":f1;
}
```
output:

3.12.4 cluster
```{.graph .center caption="边直接指向cluster" fileName="graphviz_demo_other_4"}
digraph G {
    compound=true;
    subgraph cluster0 {
        a;
    }
    subgraph cluster1 {
        b;
    }
    a -> b [lhead=cluster1];
}
```
output:

3.12.5 matrix
```{.graph .center caption="graphviz matrix" .numberLines startFrom="1" fileName="graphviz_matrix"}
digraph matrix {
    723->722
    505->732
    729->732
    731->730->729
    726->729
    730->726
    726->810->725
    729->810->725
    729->733->792->793
    722->731
    732->737->736->733
    733->810->725
    729->505
    736->506
    505->506
    179->759
    759->725
    759->737
    759->769->768->778
    768->303
    737->739->736->778
    736->769
    778->303
    506->303
    769->506
    769->780
    778->779
    736->773->774->779->780
    779->303
    780->303
    506->780
    505->724
}
```
output:

4 Blog
结合hexo一起High.
4.1 pandoc config
pandoc:
    extra:
        - standalone:
        - highlight-style: haddock
        - number-offset: 0
        - columns: 200
        - css: /css/pandoc.css
        - filter: graphviz.py
    mathEngine: mathjax
4.2 filter graphviz.py
#!/usr/bin/python3

import os
import sys
import hashlib

import pygraphviz

from pandocfilters import toJSONFilter, Para, Image
from pandocfilters import get_caption, get_extension, get_value

tmp_path = '/tmp/gitblog'
top_path = os.path.abspath(os.path.dirname(__file__))
dir_name = 'graph-image'
git_path = 'https://gitee.com/lidongai/assets_blog_post/raw/master/'
git_post = '?sanitize=true'

doc_tmpl = r"""\documentclass[12pt,border=5pt,varwidth=true]{standalone}
\usepackage{graphicx}
\usepackage[utf8]{inputenc}
\usepackage[T1]{fontenc}
\usepackage{psfrag}
\begin{document}
    \input{%s}
    \includegraphics{%s}
\end{document} """

def graphviz(key, value, format, meta):
    if key == 'CodeBlock':
        [[ident, classes, keyvals], code] = value
        if "graph" in classes:
            caption, typef, keyvals = get_caption(keyvals)
            prog, keyvals = get_value(keyvals, u"prog", u"dot")
            filetype = get_extension(format, "svg", html="svg", latex="pdf")
            md5 = hashlib.sha1(code.encode(sys.getfilesystemencoding())).hexdigest()
            basename, _ = get_value(keyvals, u"fileName")
            if basename is None:
                sys.stderr.write('not set filename in {}\n')
                exit(-1)

            latex, _ = get_value(keyvals, u"latex")
            if latex is not None:
                filetype = 'png'

            filename = basename + '.' + filetype
            while True:
                try:
                    datapath = meta['datapath']['c']
                    drafts_idx = datapath.find('_drafts')
                    if drafts_idx > 0:
                        prefix = datapath[drafts_idx+8:-3]
                    else:
                        prefix = datapath[datapath.find('_posts')+7:-3]
                    filepath = os.path.join(prefix, dir_name, filename)
                    if drafts_idx > 0:
                        localpath = os.path.join(top_path, "source/assets", filepath)
                        remotepath = os.path.join("/assets", filepath)
                    else:
                        localpath = os.path.join(top_path, "source/_assets", filepath)
                        remotepath = os.path.join(git_path, filepath) + git_post
                    if os.path.exists(localpath):
                        if os.path.exists(localpath + '.' + md5):
                            break
                        else:
                            os.system('rm -f %s*' % localpath)

                    dir = os.path.dirname(localpath)
                    if not os.path.isdir(dir):
                        os.makedirs(dir)

                    if latex is None:
                        g = pygraphviz.AGraph(string=code)
                        g.layout()
                        g.draw(localpath, prog=prog)
                    else:
                        ladot_file = os.path.join(tmp_path, '{}.ladot'.format(basename))
                        latex_file = os.path.join(tmp_path, '{}.latex'.format(basename))

                        with open(ladot_file, 'w') as f:
                            f.write(code)

                        with open(latex_file, 'w') as f:
                            f.write(doc_tmpl % ('{}.tex'.format(basename), '{}.ps'.format(basename)))

                        resolution, _ = get_value(keyvals, u"resolution")
                        if resolution is None:
                            resolution = "1200"
                        density, _ = get_value(keyvals, u"density")
                        if density is None:
                            density = "200"

                        os.system('{}/ladot {} {} {} {}'.format(top_path, ladot_file, tmp_path, resolution, density))
                        if os.path.exists('%s.png' % os.path.join(tmp_path, basename)):
                            os.system('cp %s.png %s' % (os.path.join(tmp_path, basename), localpath))

                    sys.stderr.write('Local Path [' + localpath + ']\n')
                    sys.stderr.write('Remote Path [' + remotepath + ']\n')
                    os.system('touch %s.%s' % (localpath, md5))
                except Exception as e:
                    sys.stderr.write('{}: not found datapath in meta, please patch/run.sh\n'.format(e))
                    exit(-1)
                finally:
                    break

            image = Image([ident, classes, keyvals],
                          caption,
                          [remotepath, typef])

            return Para([image])

if __name__ == "__main__":
    if not os.path.exists(tmp_path):
        os.mkdir(tmp_path)
    toJSONFilter(graphviz)
4.3 ladot
#!/usr/bin/perl

%paststubs = ();

if (@ARGV != 4) {
    die "Usage: $0 [infile] [workspace dir] [resolution] [density]";
    }

# switch to workspace dir
chdir($ARGV[1]) or die "$!";
$resolution = $ARGV[2]
$density = $ARGV[3]

# Open input and output files
open(INFILE, "<$ARGV[0]");
$ARGV[0] =~ /(.*)\.ladot$/;
$basename = $1;

if ($basename eq "") {
    $basename = $ARGV[0];
    }
open(DOTOUT, ">$basename.dot");
open(TEXOUT, ">$basename.tex");

while ($line = <INFILE>)
    {
    while ($line =~ /(\$.*?\$)(\((\d+)\))?/) {
        # print "LINE: $line";
        $sizehint = $3;
        # print "SIZEHINT: $sizehint\n";
        $tex = $1;
        $stub = make_stub($tex, $sizehint);
        $line =~ s/(\$.*?\$)(\((\d+)\))?/$stub/;
        print TEXOUT "\\psfrag{$stub}[cc][cc]{$tex}\n";
        }
    print DOTOUT $line;
    }

close(DOTOUT);
close(TEXOUT);

# Generate postscript of the graph, with stubs
system("dot -Tps $basename.dot > $basename.ps");

# LaTeX
if (-e "$basename.latex") {
    system("latex $basename.latex > $basename.latex.log");
    if (-e "$basename.dvi") {
        system("dvips $basename.dvi -D $resolution -o $basename.dvips > $basename.dvips.log");
        if (-e "$basename.dvips") {
            system("pstoimg $basename.dvips -density $density -out $basename.png > $basename.pstoimg.log");
        }
    }
}

# Graphviz 2.2 and later outputs postscript in which psfrag won't replace tags.
# This is psfrag's fault, but our problem.  Here's a fix.
system("sed -ibackup \"s/xshow/pop show/g\" $basename.ps");
# There is a way to get sed to modify in place with no backup file, but
# it seems the syntax of this option is slightly different in different
# versions of sed.  So we just remove the backup ourselves.
# unlink("$basename.psbackup");

# unlink("$basename.dot");

sub make_stub($$)
    {
    # Make a placeholder (stub) for the TeX which will be substituted for the
    # real formatted TeX later.  Arguments are TeX code and an optional
    # "hint" about the desired width of the box.

    # This is tricky because the length of the stub
    # that we choose affects how Dot formats the PostScript.  We use the
    # heuristic that the length of the LaTeX code is correlated with the
    # amount of space needed to render the LaTeX code.

    if ($paststubs{$_[0]}) {
        return $paststubs{$_[0]};
        }

    my $length = int($_[1]);
    if ($length == 0) {
        # no sizehint given
        $length = length($_[0]) - 1;
        }
    # print "LENGTH of $_[0]: $length\n";
    # The first character of an unquoted string in Dot has to be one of these.
    $first_charset="_abcdefghijklmnopqrstuvwxyzABCDEFGHIJKLMNOPQRSTUVWXYZ";
    # Subsequent characters can be any of these.
    $subseq_charset="1234567890$first_charset";
    my $stub = "";
    for (my $i = 1; $i <= $length; $i++) {
        if ($i == 1) {
            $charset = $first_charset;
            }
        else {
            $charset = $subseq_charset;
            }
        $stub .= substr($charset, int(rand(length($charset))), 1);
        }
    #print "NEW STUB for $_[0]: $stub\n";
    $paststubs{$_[0]} = $stub;
    return $stub;
    }
5 References
http://www.nrstickley.com/pandoc-markdown
http://github.com/qrsforever/git-blog-setting
https://zhu45.org/posts/2017/May/25/draw-a-neural-network-through-graphviz
https://www.iteye.com/blog/gashero-1748795#id32
https://blog.csdn.net/mouday/article/details/80902992
https://blog.csdn.net/sd10086/article/details/52979462
https://zhuanlan.zhihu.com/p/51578351